!!! Warning: This article does not constitute investment advice. Any trading losses are the responsibility of the investor. !!!
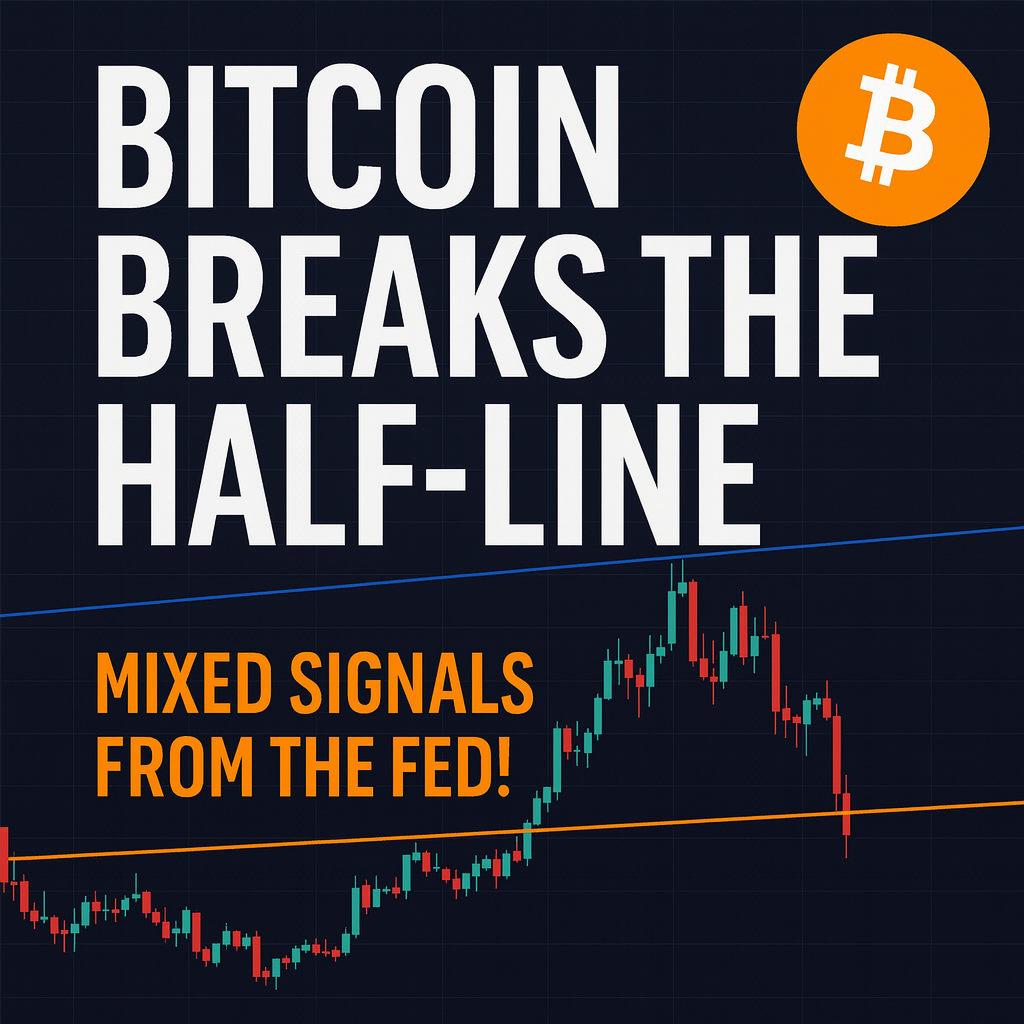
The Aftermath of the Half-Line Breakdown
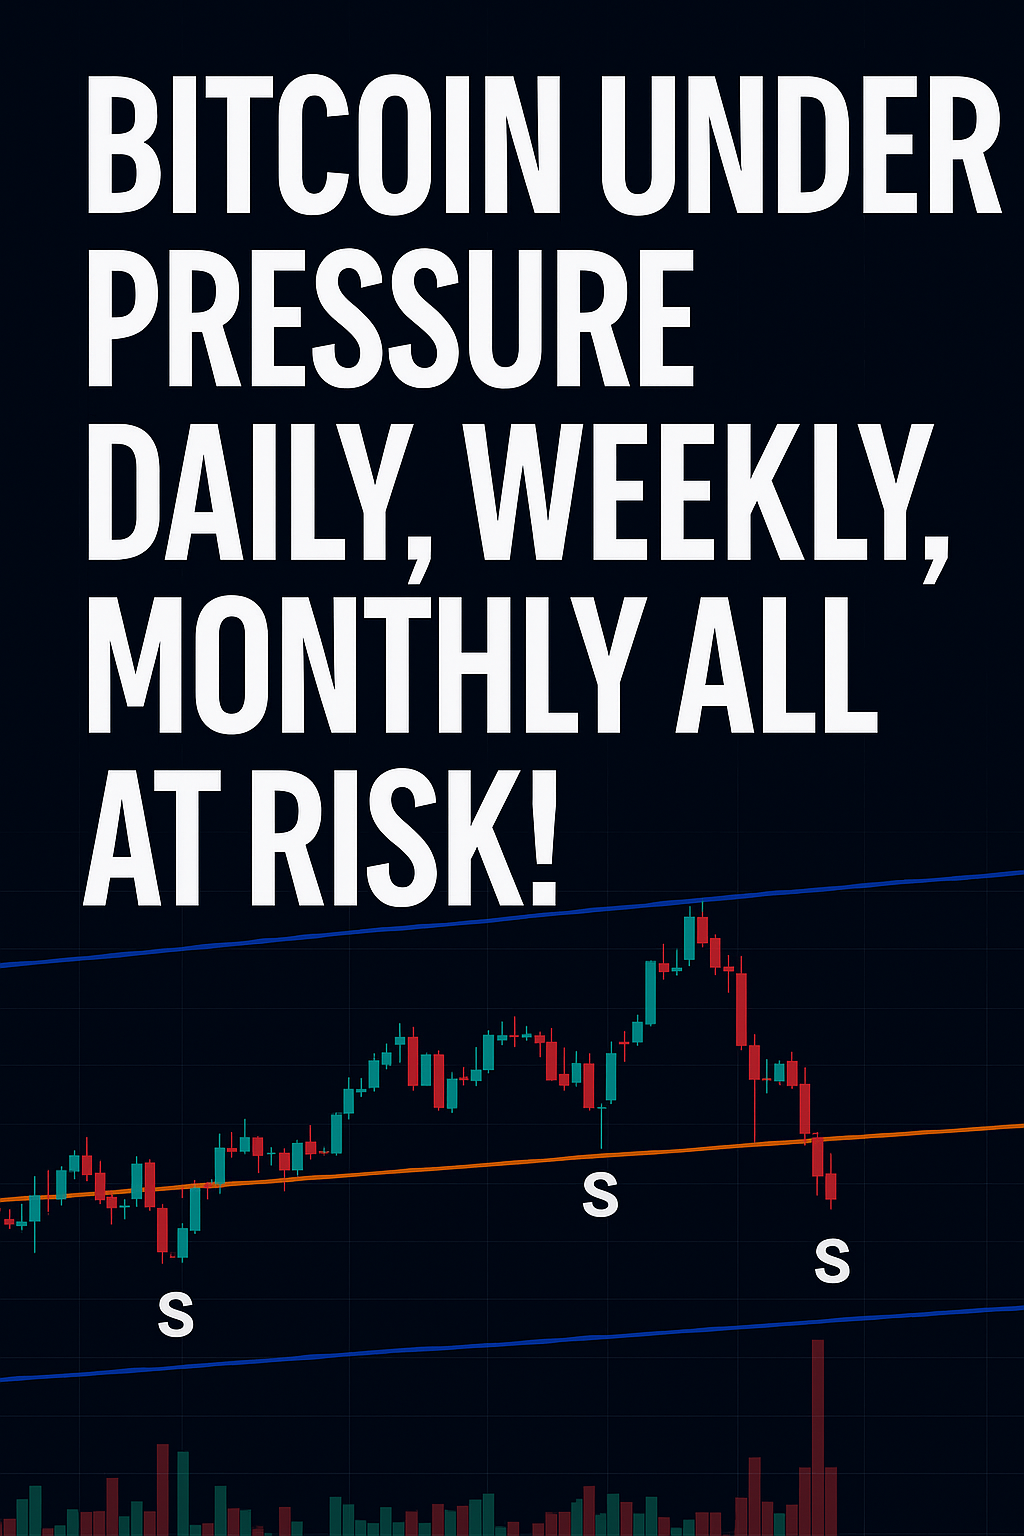
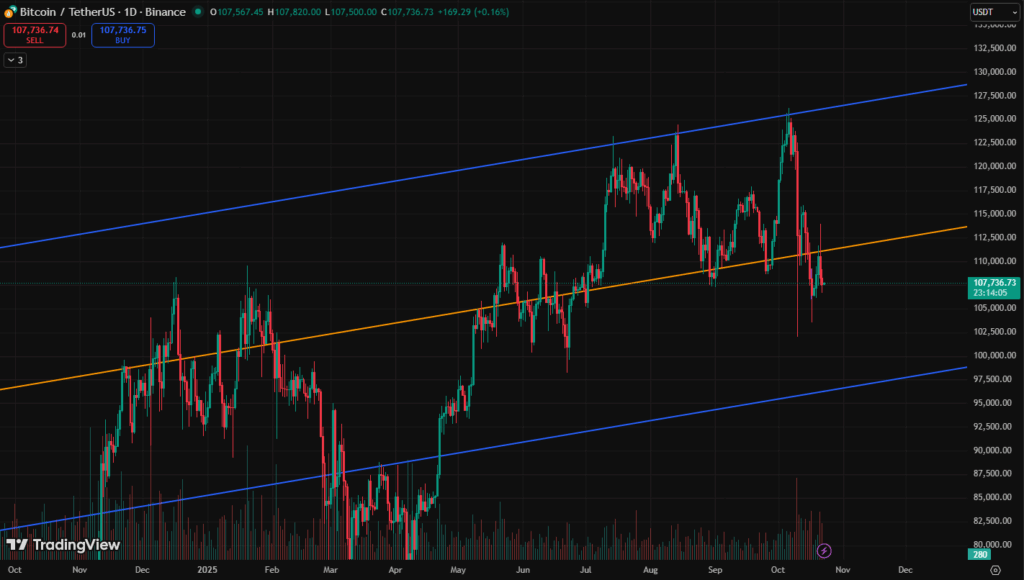
As of October 22, Bitcoin continues its gradual decline after losing the half-line support on October 21. The market appears sluggish, caught between fading momentum and cautious anticipation. For most traders reading the charts, today looks like a bearish day, with sentiment leaning toward continued downside.
From a technical standpoint, Bitcoin’s next move seems binary: either it reclaims the half-line with a 3% rise toward $111K, or it slides deeper to retest the $98K zone, which would represent roughly a 10% decline from current levels.
However, charts are only charts — they illustrate probabilities, not certainties. And in recent months, we’ve seen countless examples where Bitcoin defied technical logic due to sudden macro shocks, sentiment reversals, or liquidity events.
Market Psychology — Two Camps, One Dilemma
- The Short-Side View:
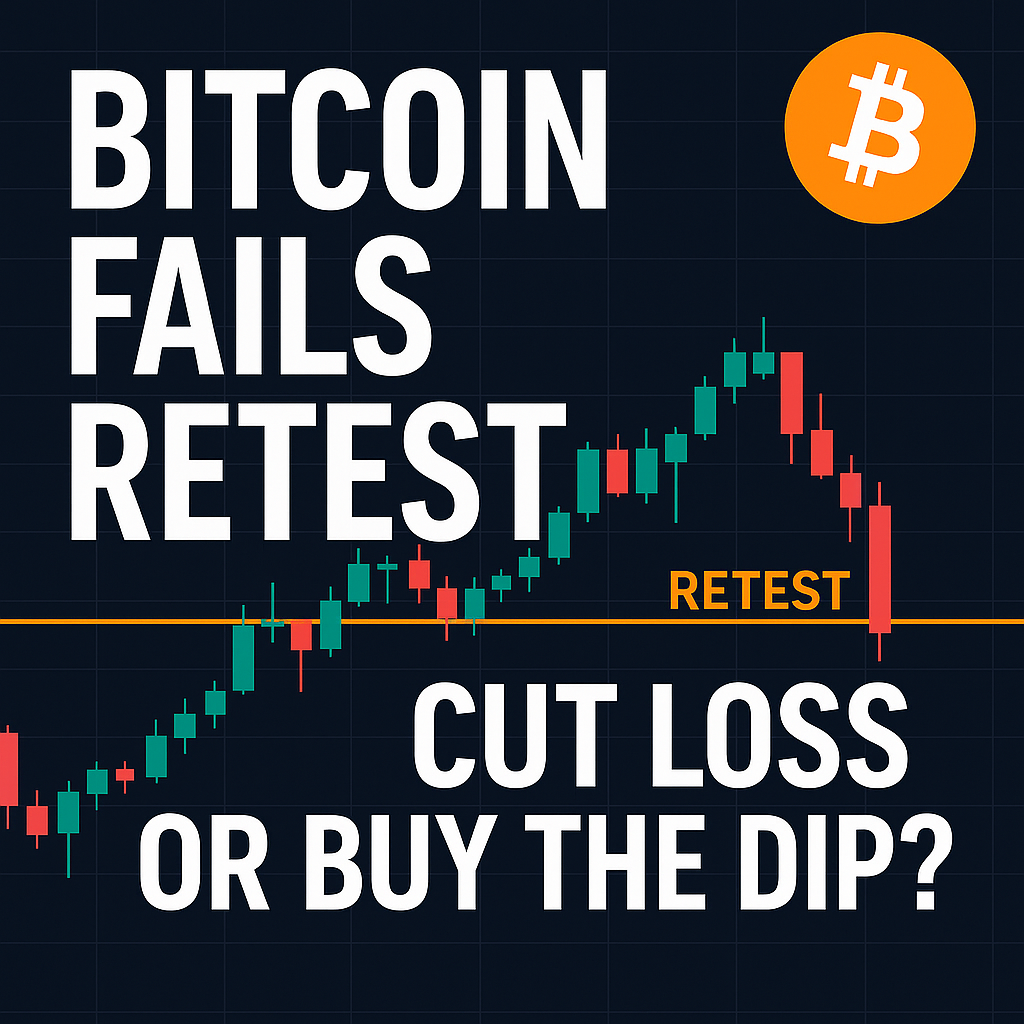
Traders looking for a short position will likely expect a short-term relief rally toward the half-line (~111K) before another breakdown. To them, any rally is merely a setup for better short entries. They see the failed half-line retest as confirmation of broader weakness. - The Long-Side View:
On the other hand, bullish traders — those still clinging to conviction — may view the same pattern as a potential bear trap. For them, every deep dip increases the chance of a strong rebound, particularly if macro conditions (rate cuts, shutdown resolution) begin to improve. Many anticipate that Bitcoin could shake out weak holders before a swift recovery. - Reality Check:
The truth likely lies somewhere in between. Both camps are correct in one sense: Bitcoin is approaching a critical inflection zone, where volatility will determine who remains solvent rather than who is right.
Technical Framework — Key Levels in Focus
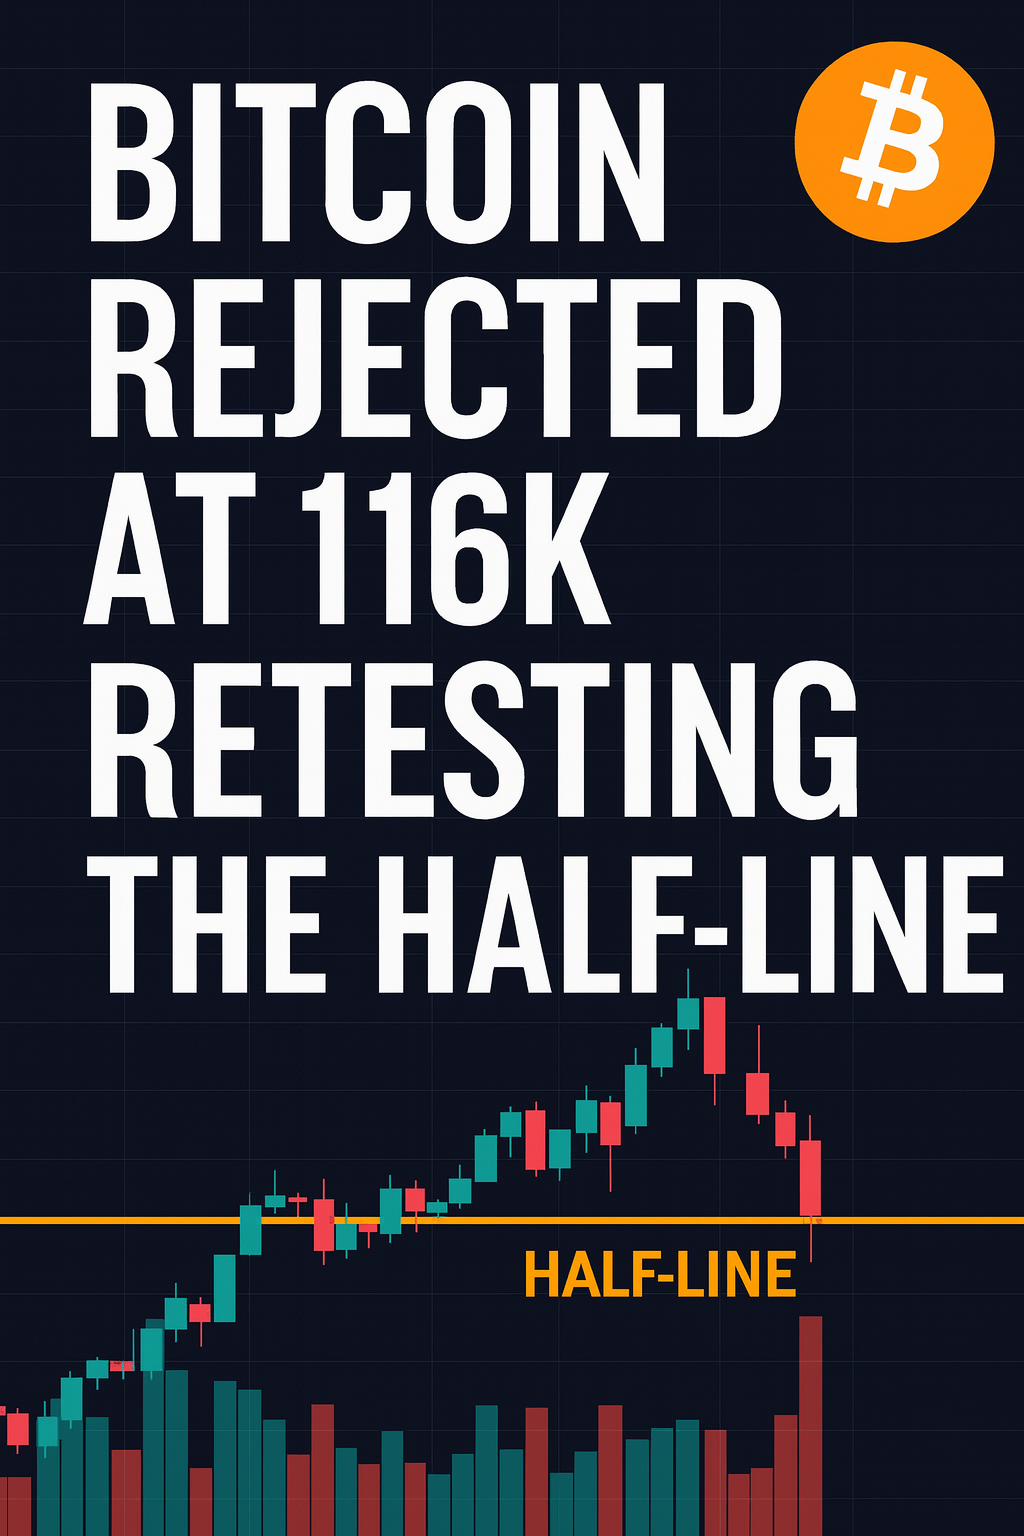
- Resistance: $111K (half-line) — reclaiming this would signal renewed bullish momentum.
- Support: $98K — a key area for potential accumulation, aligning with prior liquidity zones.
- Breakdown Risk: A daily close below $98K could trigger a deeper correction, possibly toward the mid-90K region.
- Upside Potential: If Bitcoin rebounds strongly above $111K with volume confirmation, short-covering could push prices back to 114K–116K.
In other words, Bitcoin’s next 3% move will likely define its next 10% trend. For now, the range between 98K–111K will act as the battlefield for both sides.
Strategy — Managing Risk Amid Confusion
This is the kind of market where discipline matters more than conviction.
Those planning to short must accept that Bitcoin may rally before falling, while those staying long must prepare for a potential liquidity sweep below 100K.
The key takeaway:
- Avoid all-in positions.
- Respect stop levels.
- Consider laddered (scaled) entries instead of timing perfection.
While everyone’s watching the 98K level as a potential “bottom,” remember — if everyone expects the same outcome, markets often do the opposite first.

Between Fear and Greed

Whether Bitcoin bounces or collapses from here, this zone will define trader psychology for the rest of October. The market has taught the same lesson repeatedly: overconfidence is punished, patience is rewarded.

So, before opening that short — ask yourself:
Are you trading your conviction, or are you following the crowd?