!!! Warning: This article does not constitute investment advice. Any trading losses are the responsibility of the investor. !!!
Every Timeframe Flashes Warning Signs
Bitcoin now stands at a crossroads that demands attention from both short-term traders and long-term investors.
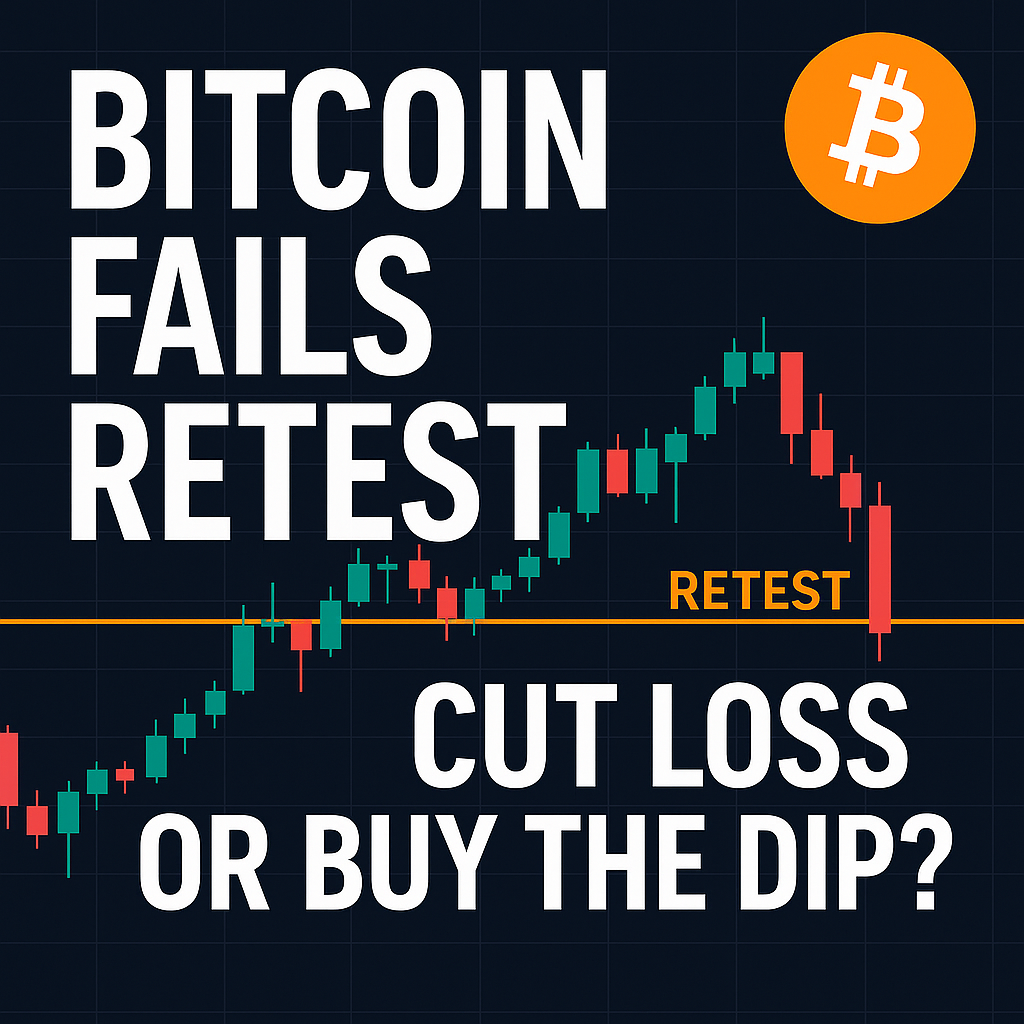
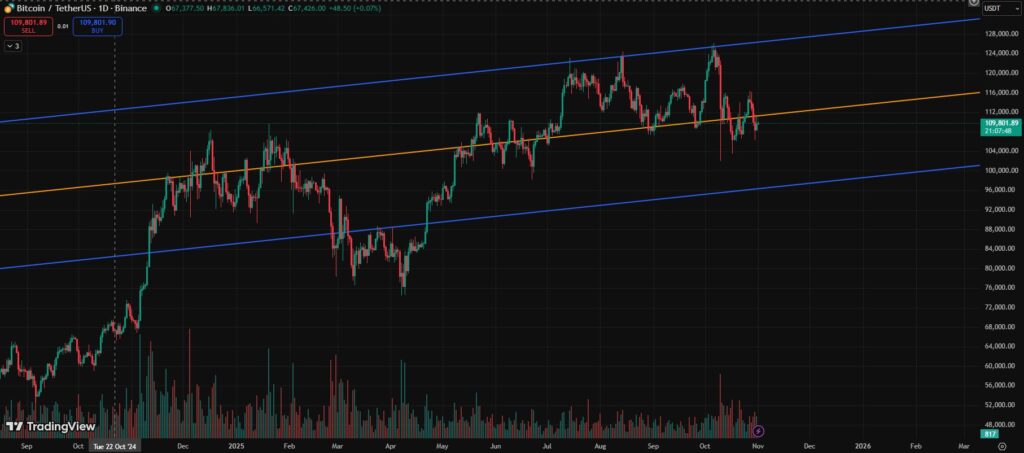
After failing to hold the half-line support near 111K, Bitcoin has slipped further to around $109K (BINANCE:BTCUSDT 기준). Although the price remains close enough to potentially retest the half-line again, the overall tone has shifted from neutral to cautious.
This moment is unique — for the first time in several weeks, the daily, weekly, and monthly charts are all simultaneously flashing potential risk signals, indicating that the market is in a fragile equilibrium.
Technical Overview — Multi-Timeframe Pressure Building
From a charting perspective, Bitcoin’s movement over the past few sessions reveals consistent weakness across key timeframes:
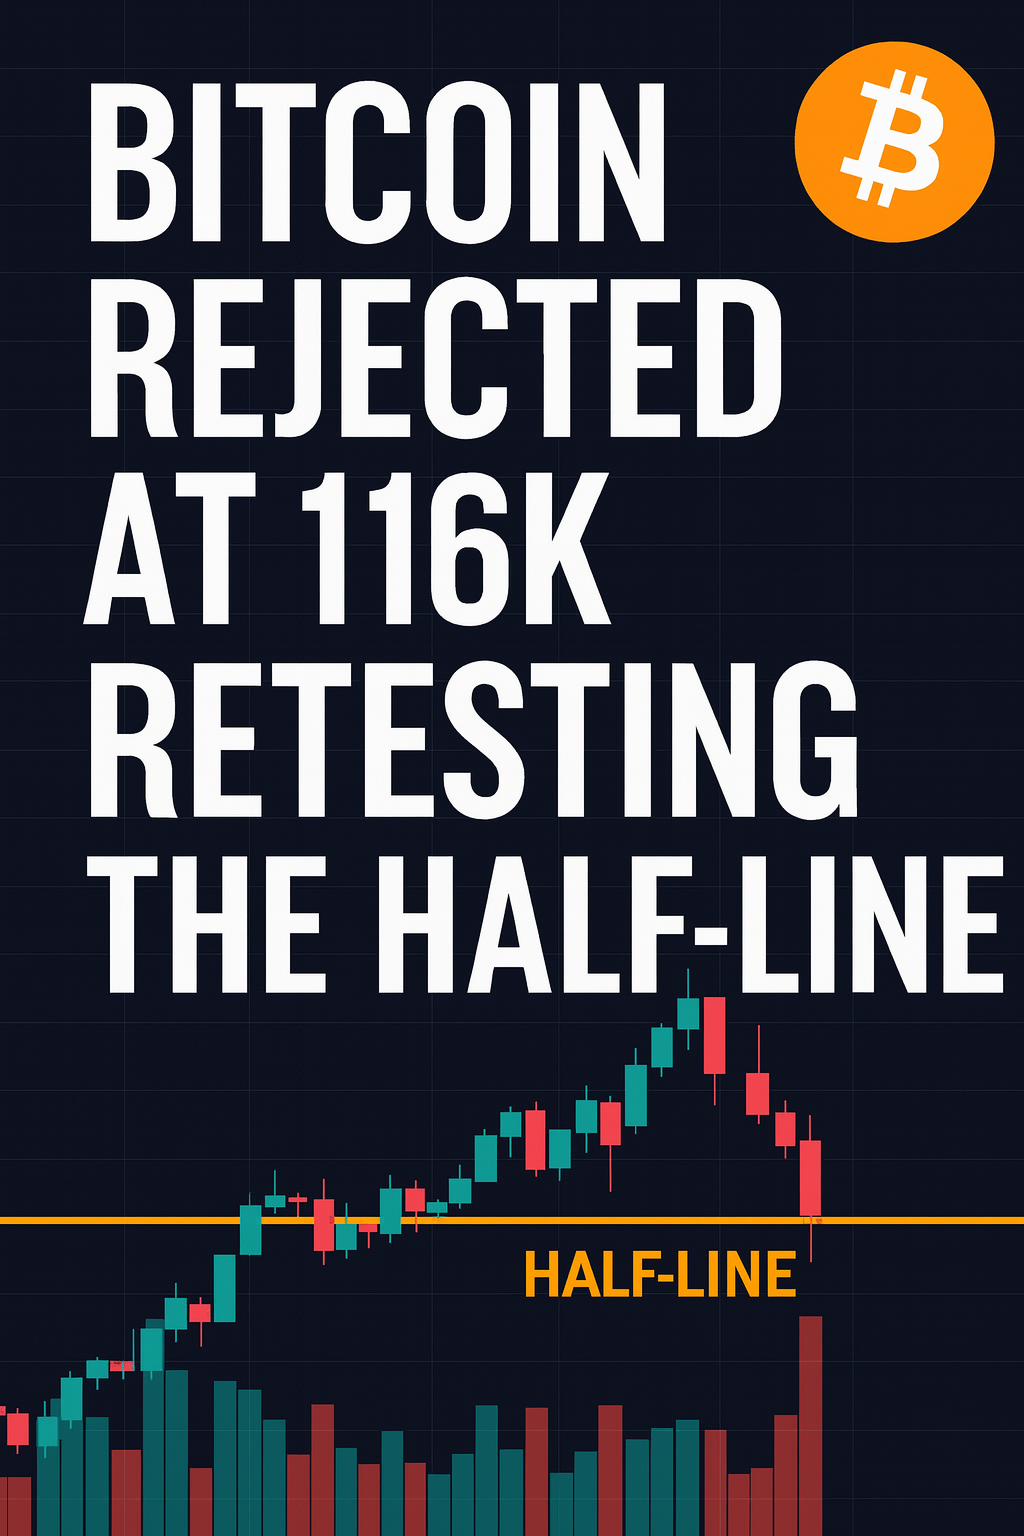
- Daily Chart: Shows continued lower highs since the rejection at 116K, with price now struggling to regain the 111K–112K half-line zone.
- Weekly Chart: The weekly structure has turned neutral-to-bearish, forming a descending pattern that suggests momentum loss unless Bitcoin quickly reclaims 114K.
- Monthly Chart: A new monthly candle has just opened, and early signs indicate expanded volatility — both upward and downward swings are likely in the coming days.
The current trading channel spans roughly 98K (support) to 125K (resistance). This range defines Bitcoin’s near-term battlefield.
If Bitcoin fails to establish a base above 110K within this week, technical traders warn of a deeper retest toward 106K–104K, possibly even the 98K channel bottom.
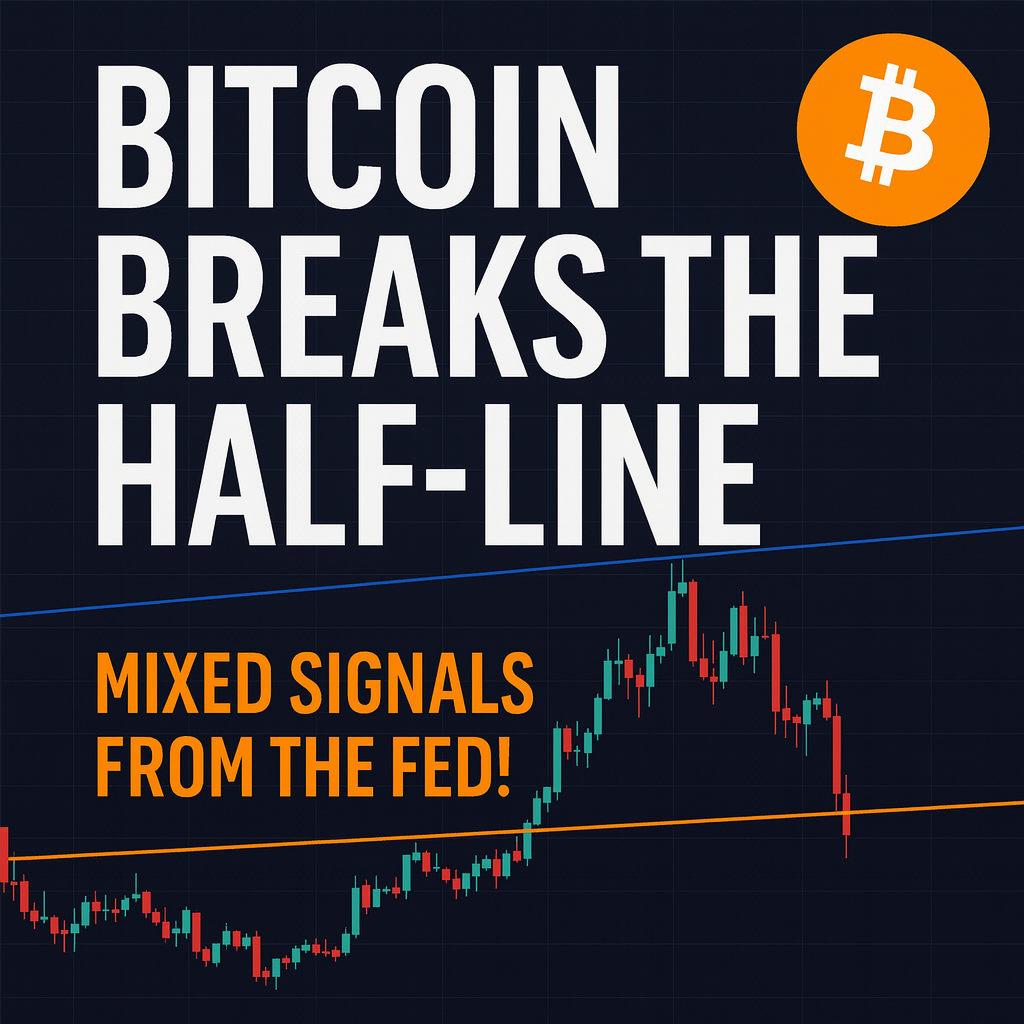
Market Context — Conflicting Signals Everywhere
The broader macro narrative remains conflicted:
- Bullish Factors:
- Continued discussions about rate cuts and liquidity easing still support long-term optimism.
- The shutdown resolution has provided a temporary sense of stability.
- Bearish Factors:
- Disagreement within the Federal Reserve over the timing and magnitude of rate cuts has rattled confidence.
- Global markets — from Nasdaq to gold — have also shown weakness, signaling cautious sentiment across the board.
As a result, Bitcoin is caught between opposing forces — macroeconomic hope on one side, technical fragility on the other.
Trader’s View — High Volatility, High Risk
For spot investors, this zone may appear tempting for gradual accumulation, especially with price still hovering near multi-week lows.
However, for futures traders, this is one of the most dangerous areas of the current cycle.
- The expected volatility exceeds 10%, which means leveraged positions could be wiped out in hours.
- The safest strategy is to wait for confirmation: either a strong daily close back above 111K (bullish case) or a clean breakdown below 108K (bearish case).
Until one side takes control, discipline outweighs prediction.

Between Fear and Conviction
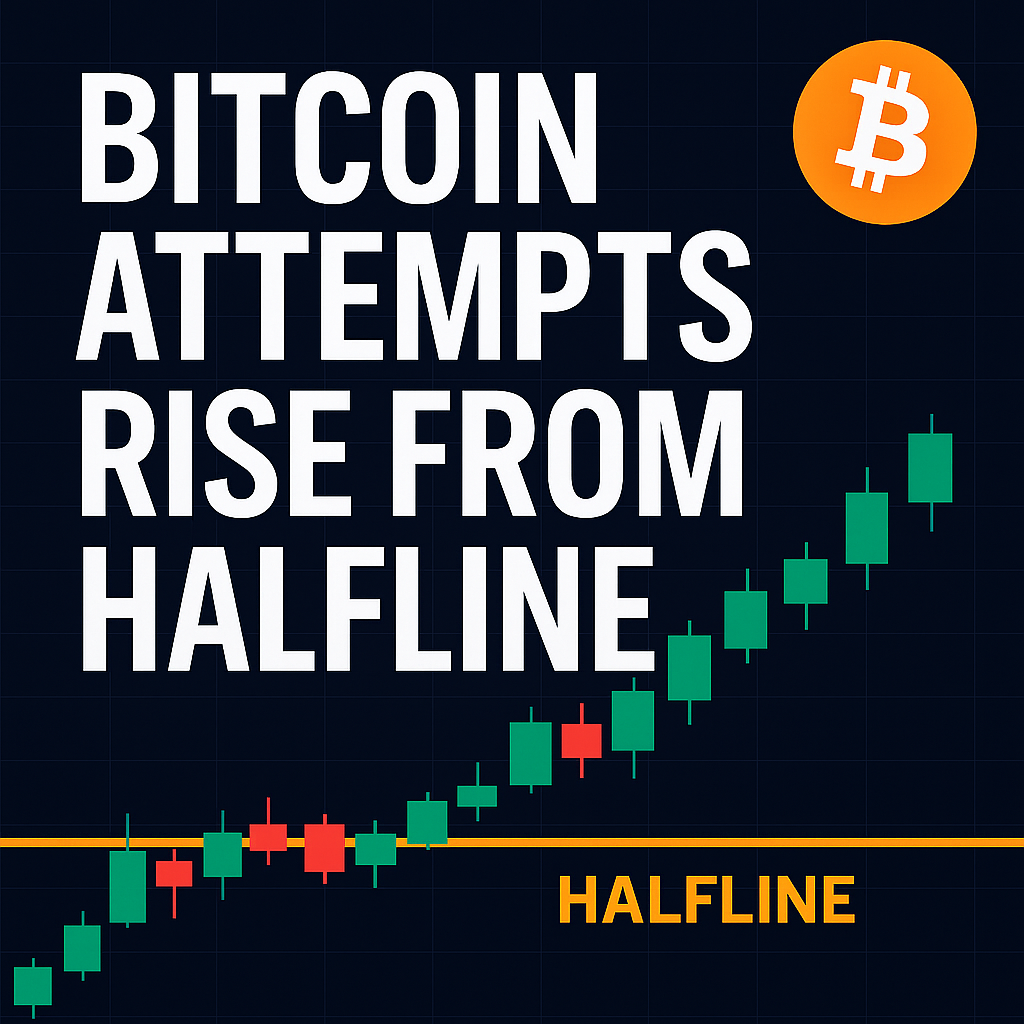
Bitcoin’s position near 109K embodies the uncertainty of this market. The asset is close enough to spark another recovery, yet fragile enough to trigger further declines.
If the half-line can be reclaimed this week, the next move toward 114K–116K is possible. But if 108K fails to hold, the lower channel near 98K could be revisited faster than expected.
Across all timeframes — daily, weekly, and monthly — Bitcoin is in a moment of truth.
Will traders see this as a buy-the-dip opportunity, or as a final warning before deeper correction?
Your decision at this level may define not just your short-term trade — but your conviction in Bitcoin itself.